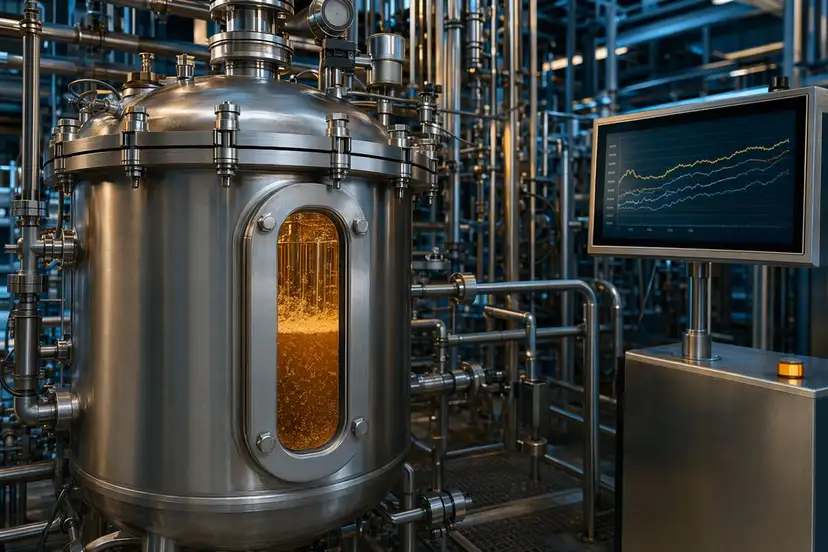
Protein Hydrolysate QC Metrics Managers Track
Operational QC metrics for protein hydrolysate production managers: hydrolysis control, yield stability, viscosity, filtration behavior, and batch consistency.
Request pricing Operational QC metrics for protein hydrolysate production managers: hydrolysis control, yield stability, viscosity, filtration behavior, and batch consistency.
Request pricingFor a protein hydrolysate manufacturer, quality control is not limited to final release. The most useful metrics are the ones that help production managers see whether the batch is moving inside the intended processing window before yield, taste, solubility, or filtration behavior starts to drift.
Peptarion works as an enzyme supplier for protein hydrolysate production with a practical focus: controlled hydrolysis, repeatable batch behavior, and technical support that connects enzyme selection to plant realities.
Protein substrates are naturally variable. Different raw material lots can shift moisture, fat carryover, mineral load, native protein structure, and impurity profile. If the enzyme program is not matched to that variation, the same process recipe can deliver different results.
Production managers typically track QC indicators to answer four operational questions:
The objective is not to collect more data. The objective is to make earlier decisions that protect throughput and finished-product consistency.
Hydrolysis control starts before the enzyme is added. Incoming protein quality sets the boundary for the rest of the batch.
Production teams should monitor:
When raw material variation is visible early, enzyme selection and processing conditions can be adjusted before the batch enters the most sensitive part of hydrolysis.
Degree of hydrolysis is one of the central indicators of process direction. It helps production managers understand whether the protein chain breakdown is progressing toward the intended functional or nutritional target.
The key is not only the final value. The trend matters. A stable process should show controlled movement through the expected hydrolysis curve, without sudden acceleration or plateauing that forces reactive corrections.
A practical QC view should connect degree of hydrolysis to:
Peptarion supports customers in selecting enzyme systems that help target a defined cut pattern rather than simply pushing hydrolysis harder.
Two batches can show similar overall hydrolysis levels while behaving differently in application. Peptide profile gives production and technical teams a better view of how hydrolysis has shaped the material.
Depending on the product, peptide distribution may influence:
For production managers, the value is operational: peptide profile helps explain why a batch passes one metric but still performs differently downstream or in customer use.
Viscosity is one of the most immediate plant-floor indicators. If the slurry thins too quickly, remains too heavy, or changes unpredictably, the issue may appear later as poor heat transfer, uneven mixing, pump strain, filtration pressure, or inconsistent solids handling.
Track viscosity behavior against processing stage, not only at the end of the batch. Useful checkpoints include:
A controlled enzyme program should support a predictable viscosity shift that operators can plan around.
Yield is often where process variation becomes financially visible. In hydrolysate production, yield is tied to how effectively the protein is converted into soluble material and how much usable product survives downstream operations.
Production managers should connect soluble yield with:
If yield is high but filtration is poor, the process may still be expensive. If filtration is easy but functional performance is weak, hydrolysis may not have gone far enough. The best enzyme fit supports both recovery and product intent.
Downstream performance is one of the clearest signs that hydrolysis is under control. A batch that looks acceptable in the reactor can still create load in filters, separators, evaporators, or dryers.
Track indicators such as:
When these indicators drift, enzyme choice may be part of the solution. The goal is not only to reach the hydrolysis target, but to reach it in a way that supports the next operation.
Color and odor changes can indicate heat history, raw material variation, microbial risk, oxidation, or over-processing. For hydrolysates used in food, nutrition, pet nutrition, fermentation, or specialty applications, these attributes can strongly affect customer acceptance.
Production teams should treat sensory direction as a process signal, not only a final QC observation. A drift in odor or color may point to changes in substrate quality, residence time, temperature exposure, or hydrolysis endpoint.
Enzyme performance depends on controlled operating conditions. Even a well-selected enzyme can deliver inconsistent results if pH, temperature, or residence time varies beyond the intended window.
Managers should review process data for:
The practical question is simple: are the operating conditions stable enough for the enzyme to produce the same hydrolysis pattern from batch to batch?
Final QC confirms whether the batch meets customer and internal requirements. It should also feed back into process control.
Common final consistency checks include:
For production managers, final QC should close the loop. If a batch passes but required unusual operator correction, the process still needs attention.
A useful dashboard should be simple enough for production decisions and detailed enough for technical review. Group metrics by decision point:
This structure helps teams see whether a quality issue starts with substrate variability, process control, enzyme fit, or downstream handling.
The enzyme system influences more than hydrolysis speed. It can shape processing windows, peptide profile, viscosity reduction, soluble recovery, flavor direction, and downstream load.
When evaluating an enzyme supplier, production managers should ask:
Peptarion focuses on this operational connection. We supply enzymes for protein hydrolysate manufacturing and support customers with application guidance for controlled, repeatable production.
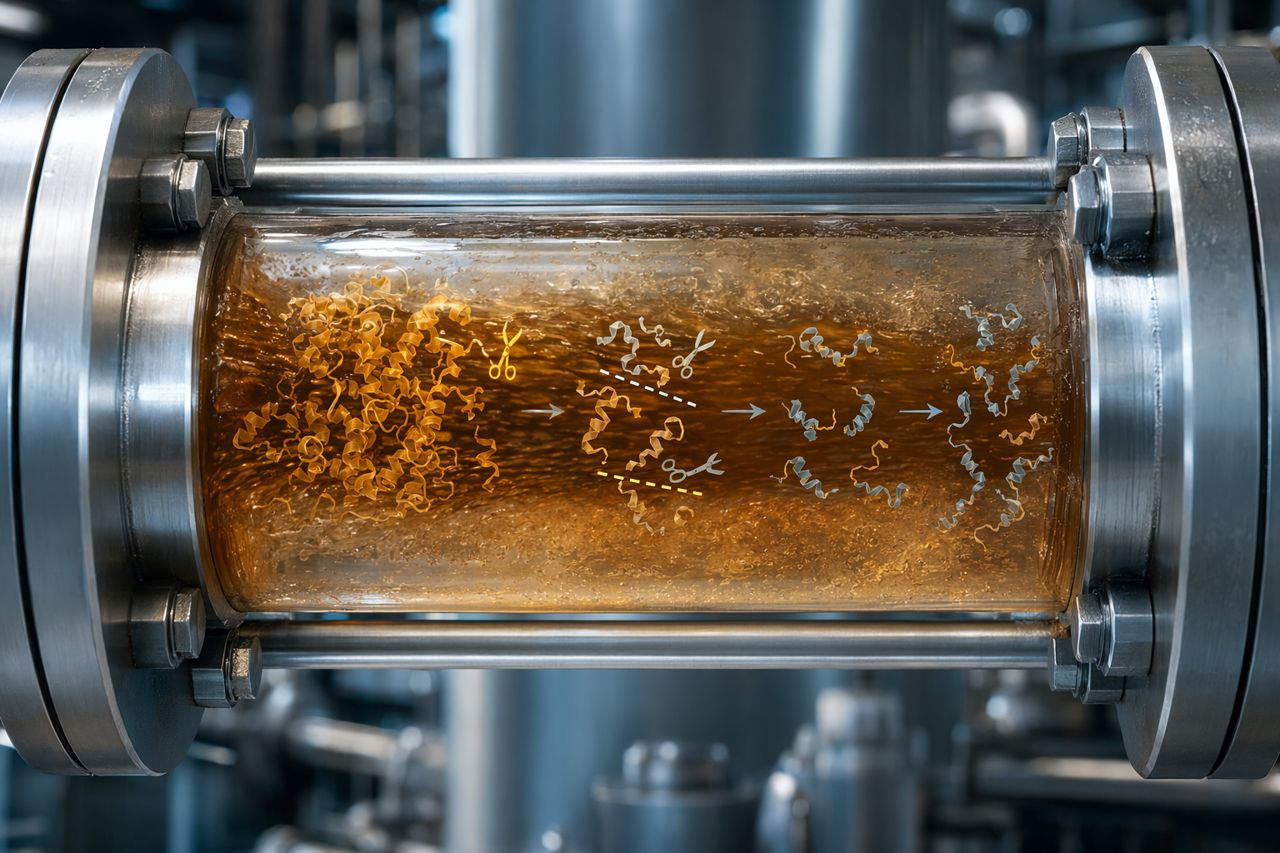
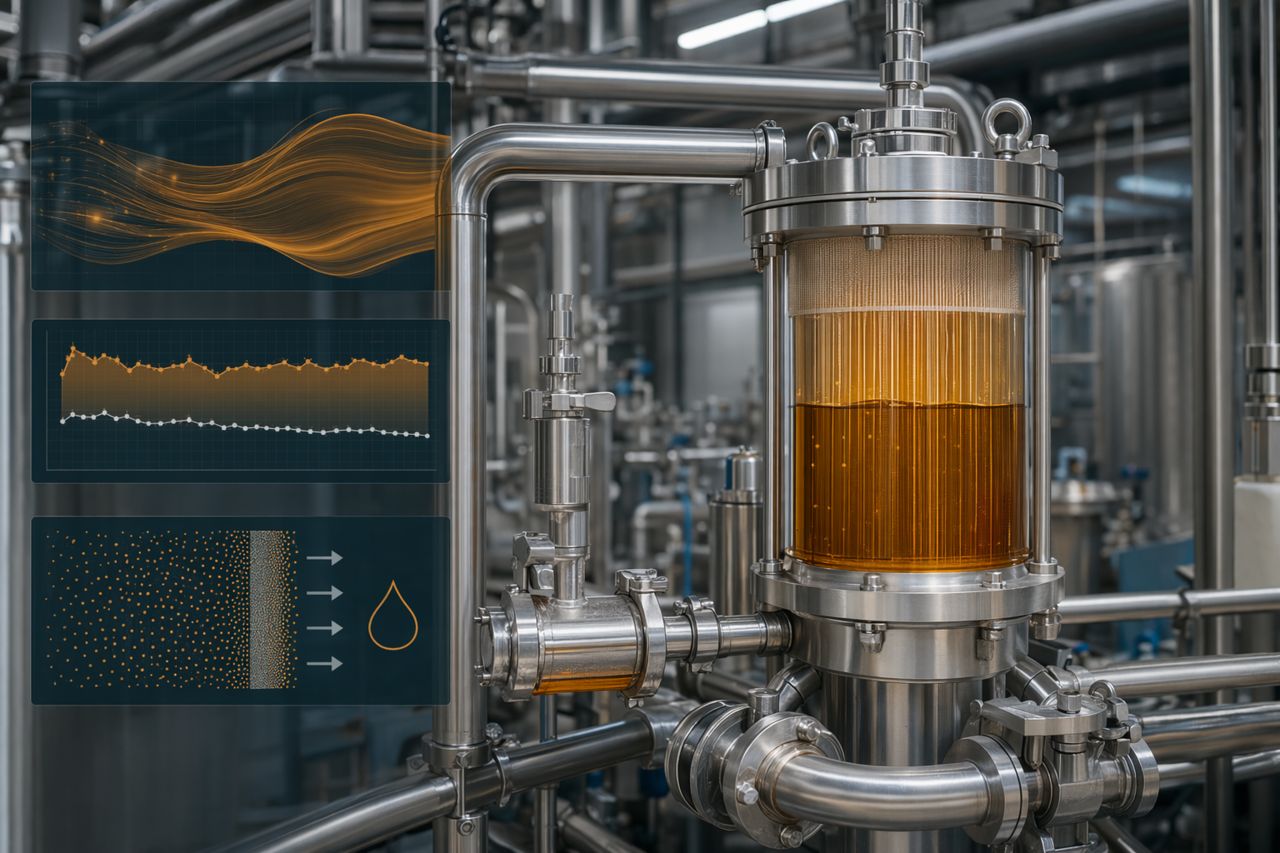
[Faceless explainer video embed: amber protein slurry in stainless processing, animated peptide cut-lines, QC overlays for hydrolysis trend, viscosity shift, filtration behavior, and yield stability. Voiceover with on-screen subtitles.]
A single out-of-range result may be manageable. Repeated small shifts are more important because they often indicate the process window is narrowing.
Watch for:
These signs often appear before a formal quality failure. Acting early helps protect throughput and margin.
If you are reviewing a new substrate, scaling production, improving batch consistency, or investigating filtration and yield drift, Peptarion can help evaluate the enzyme fit for your line.
Use the on-site request a quote form to share your substrate, process goal, and current production challenge. A Peptarion technical specialist will respond with next steps for enzyme selection and process discussion.
Tell us your application and volume — we reply with pricing and lead time.